


Spectrum Bundle
MOST POPULAR- Wi-Spy Lucid$999
- Chanalyzer$750
- Device Finder$129
- 1yr Chanalyzer MetaCare$150
Buy separately$2,028
Bundle price$1,599
✓ You save $429
Save up to $1,089 versus buying the tools separately

With Report Builder
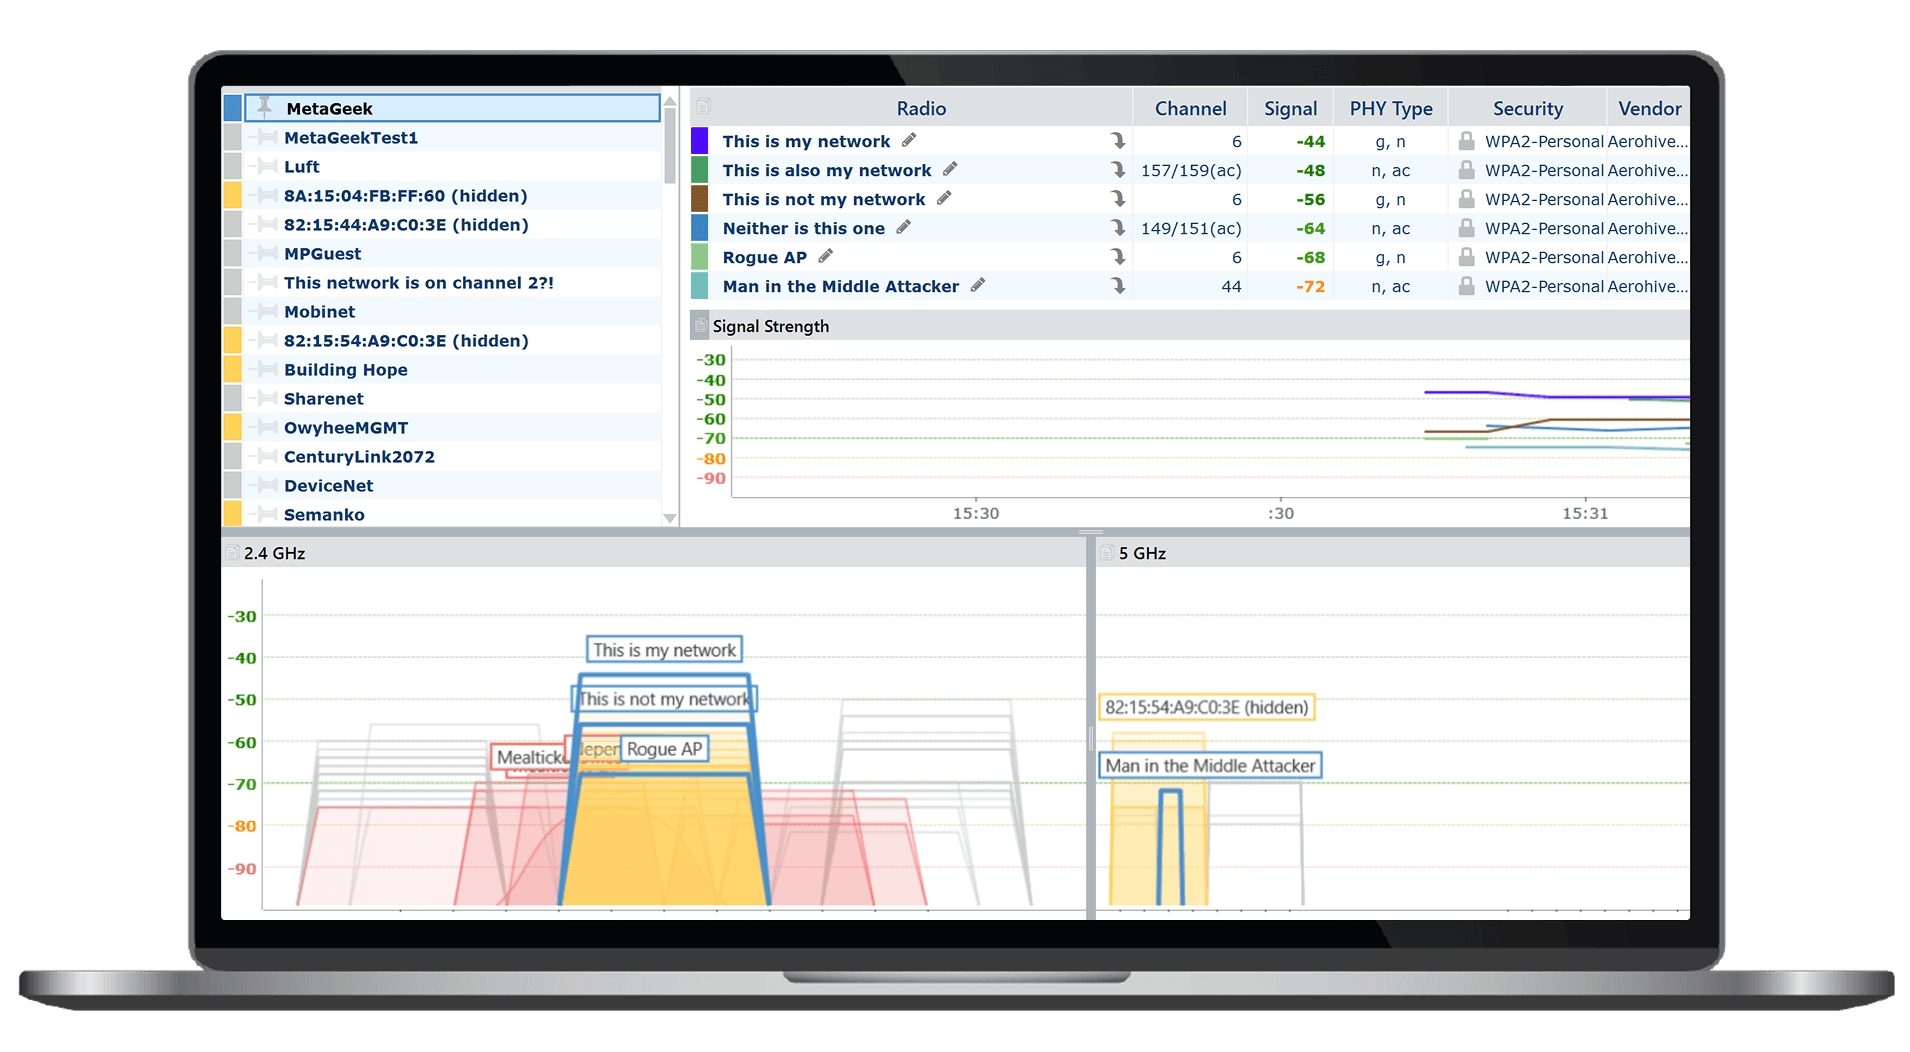
Defeat Slow Wi-Fi
Perpetual License

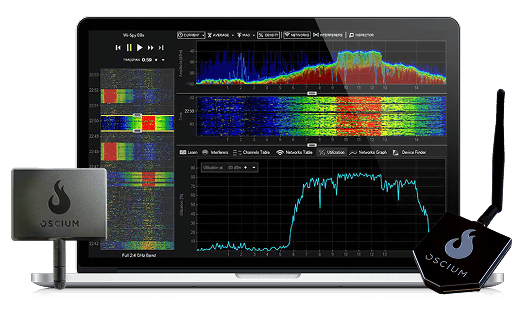
Spectrum Analyzer

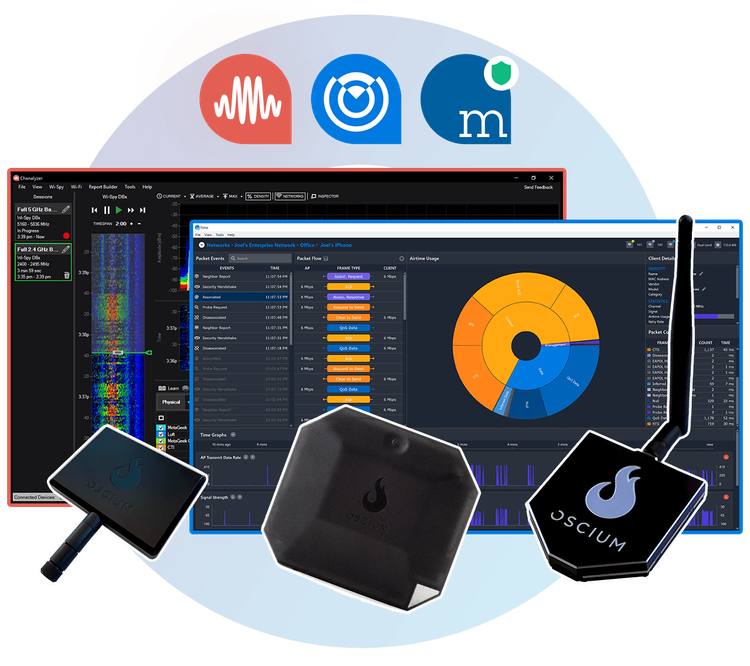
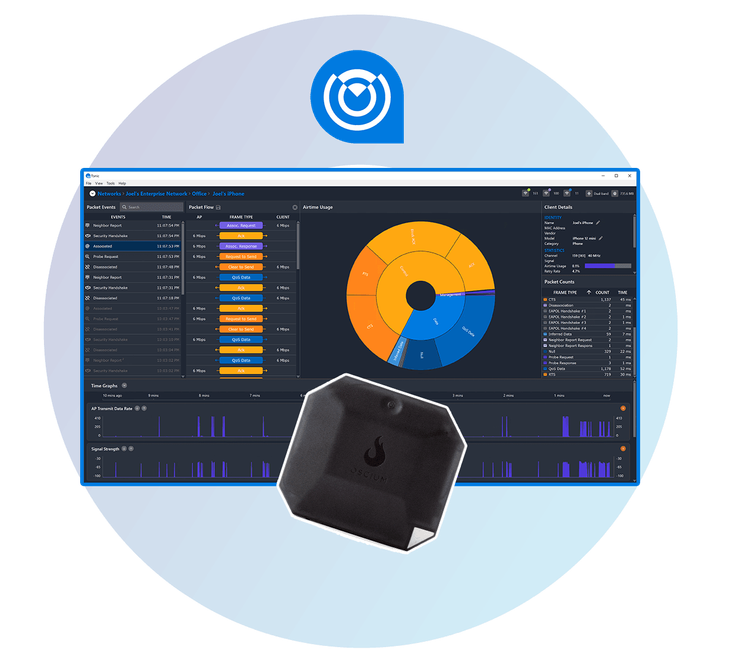
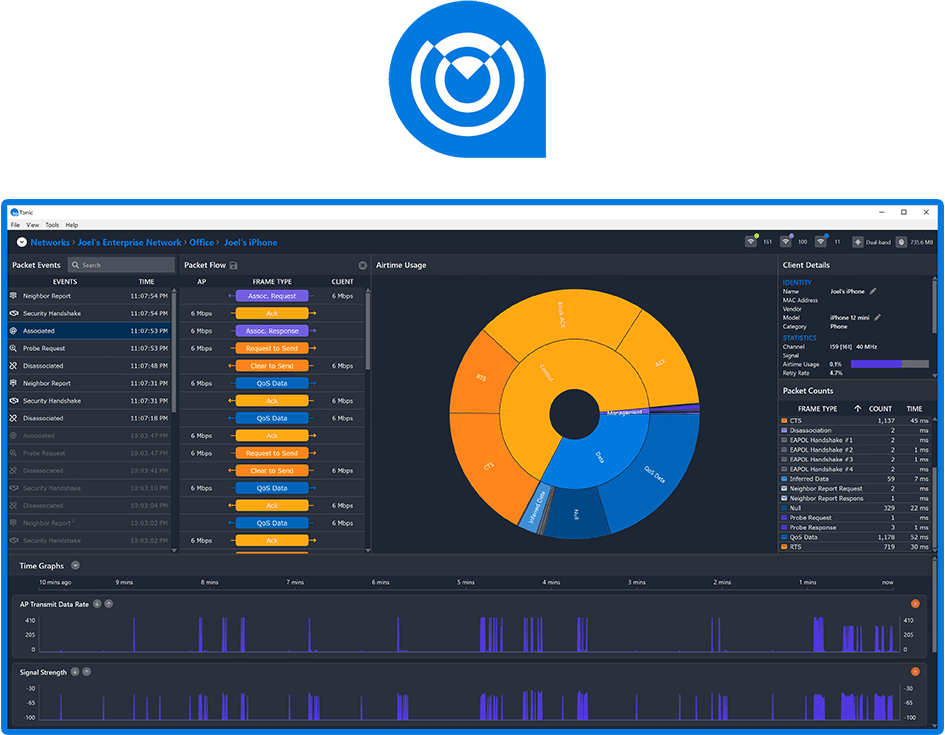
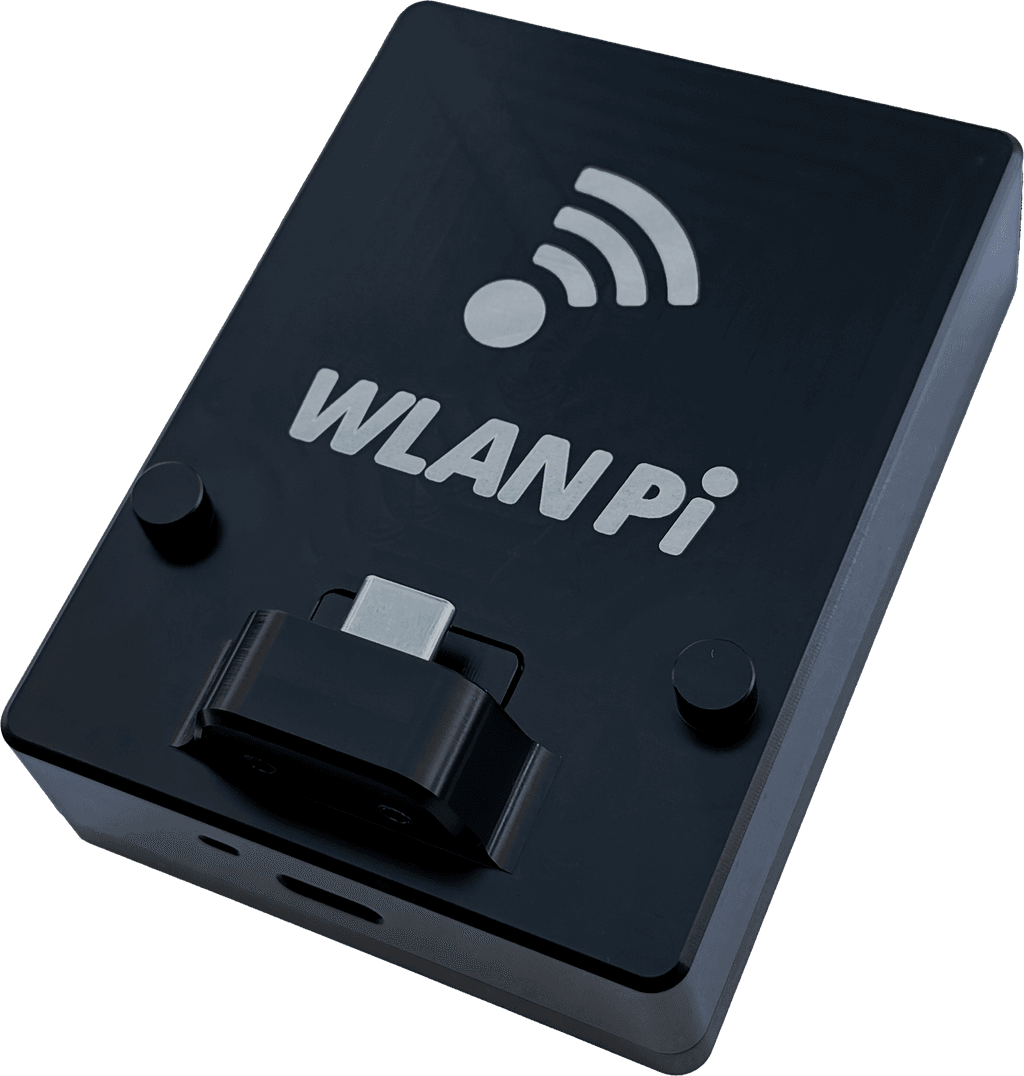
A wearable Wi-Fi packet capture powerhouse
Wi-Fi 7 Packet Capture

Spectrum Analyzer
Chanalyzer includes an initial free year of MetaCare.
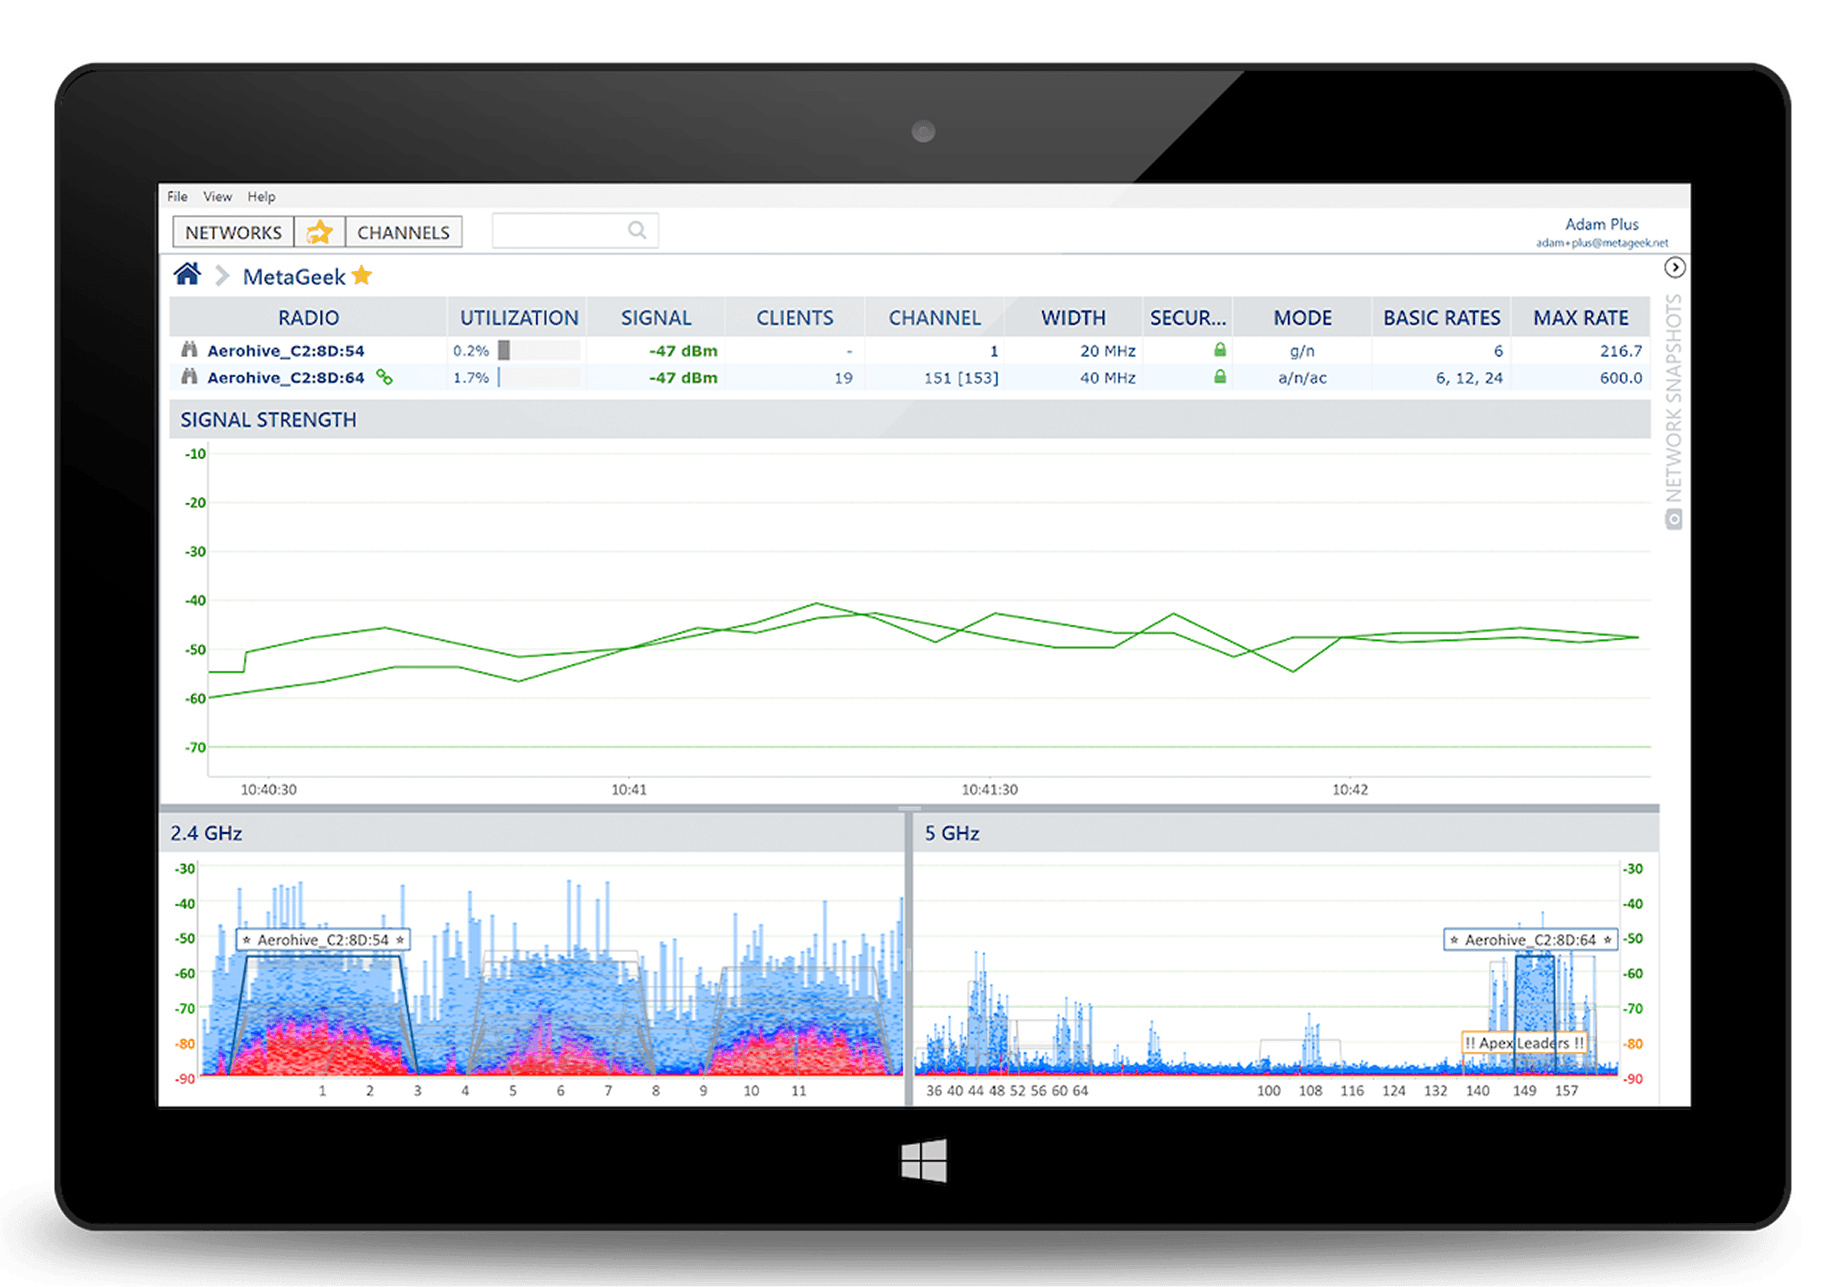
Super-charge inSSIDer with Snapshots, packet capture, and more with Metageek Plus.
MetaGeek App includes an initial free year of MetaCare.

Omni-directional
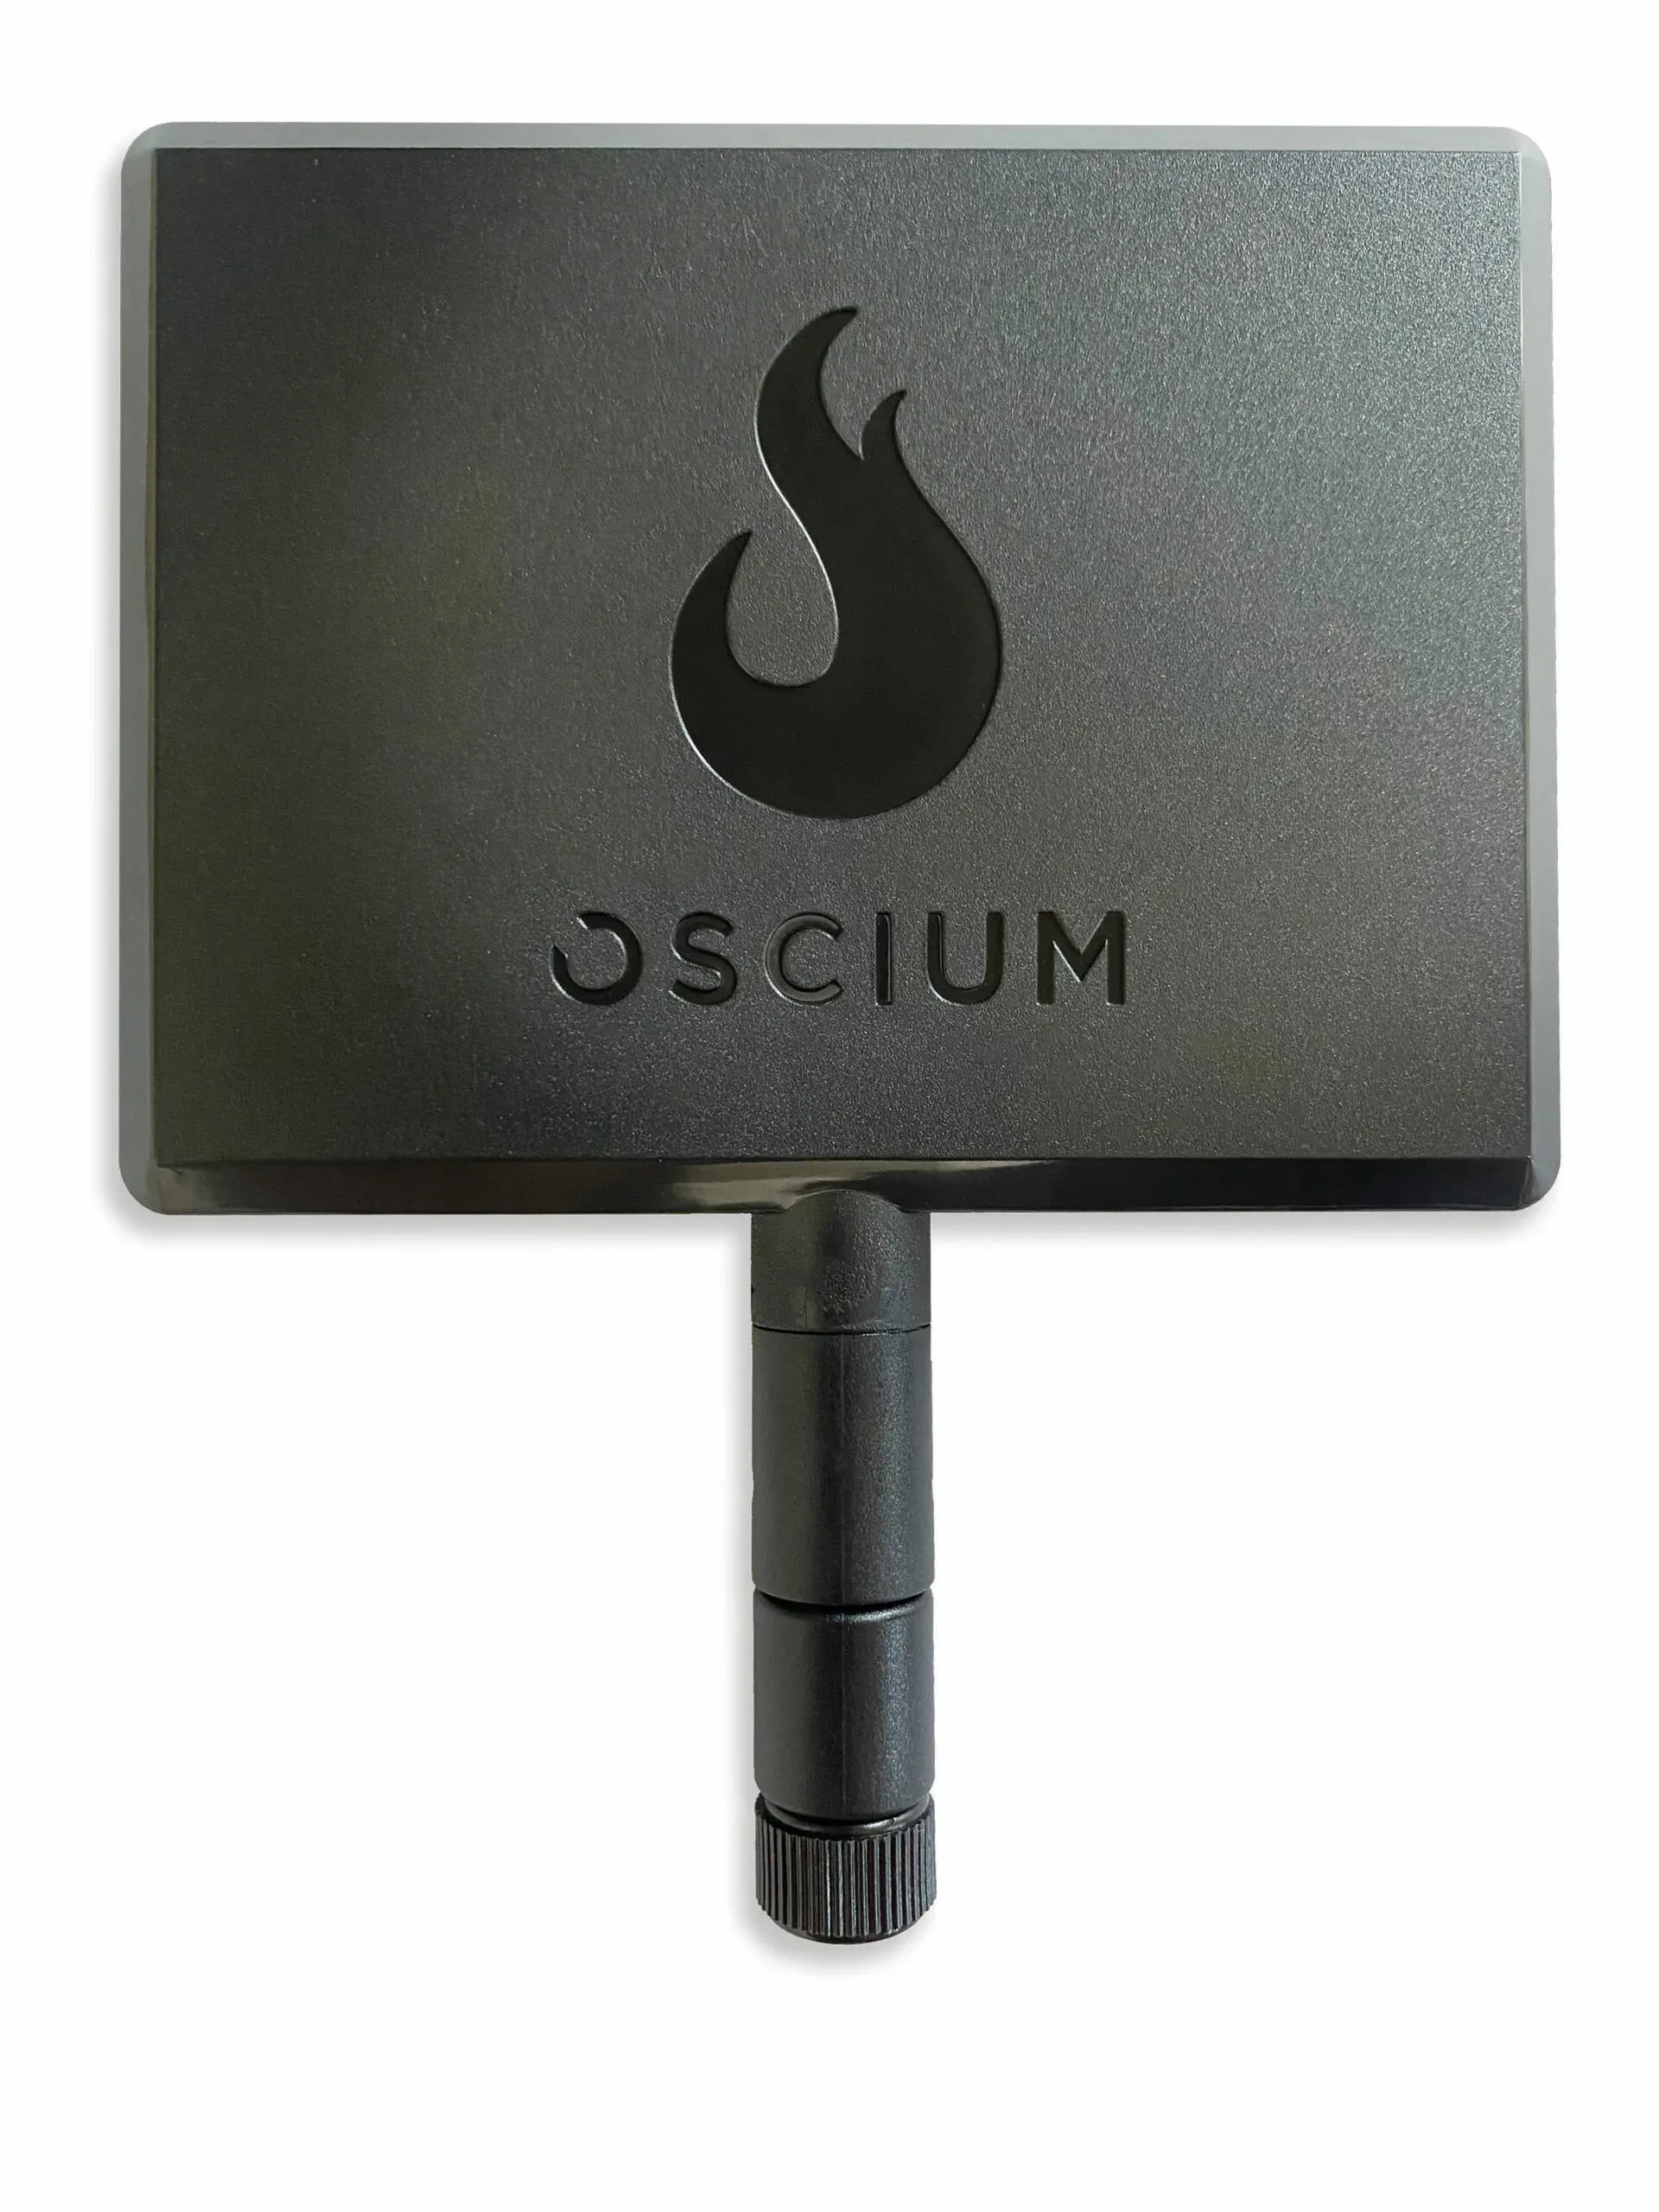
Directional Antenna
Defeat Slow Wi-Fi
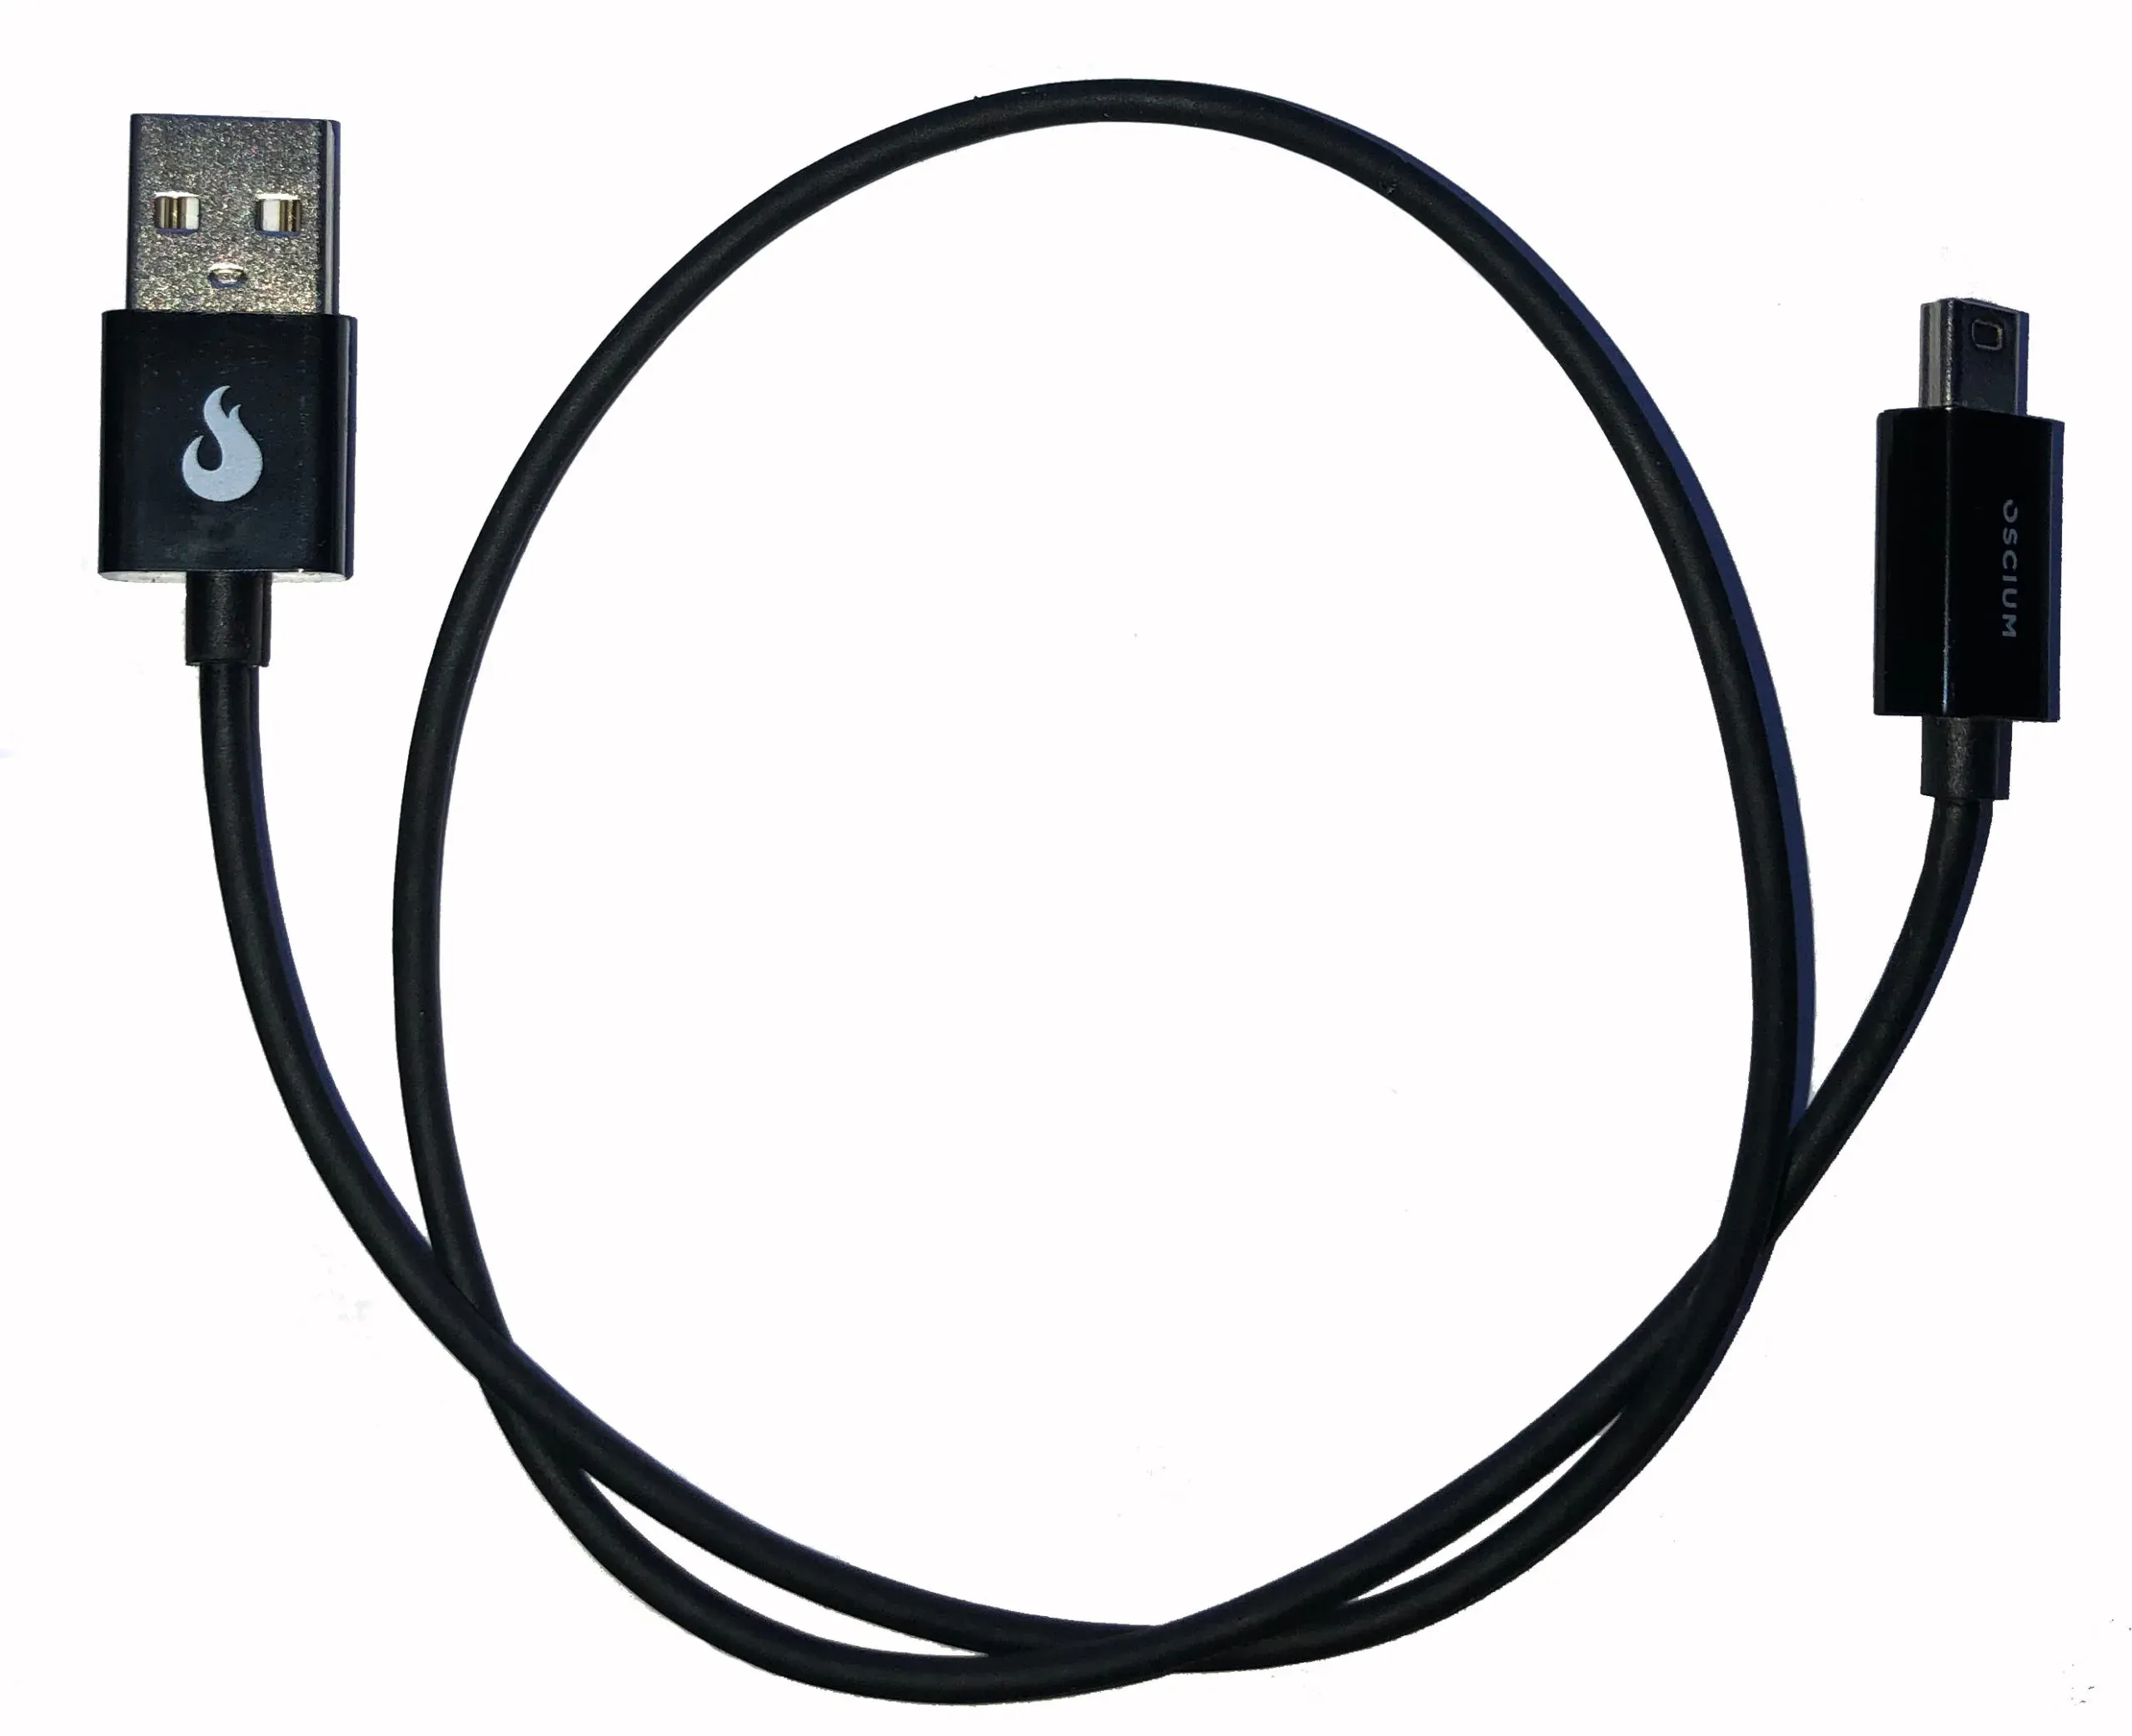
Mini-B to USB A 20-inch Cable. USB-OTG.
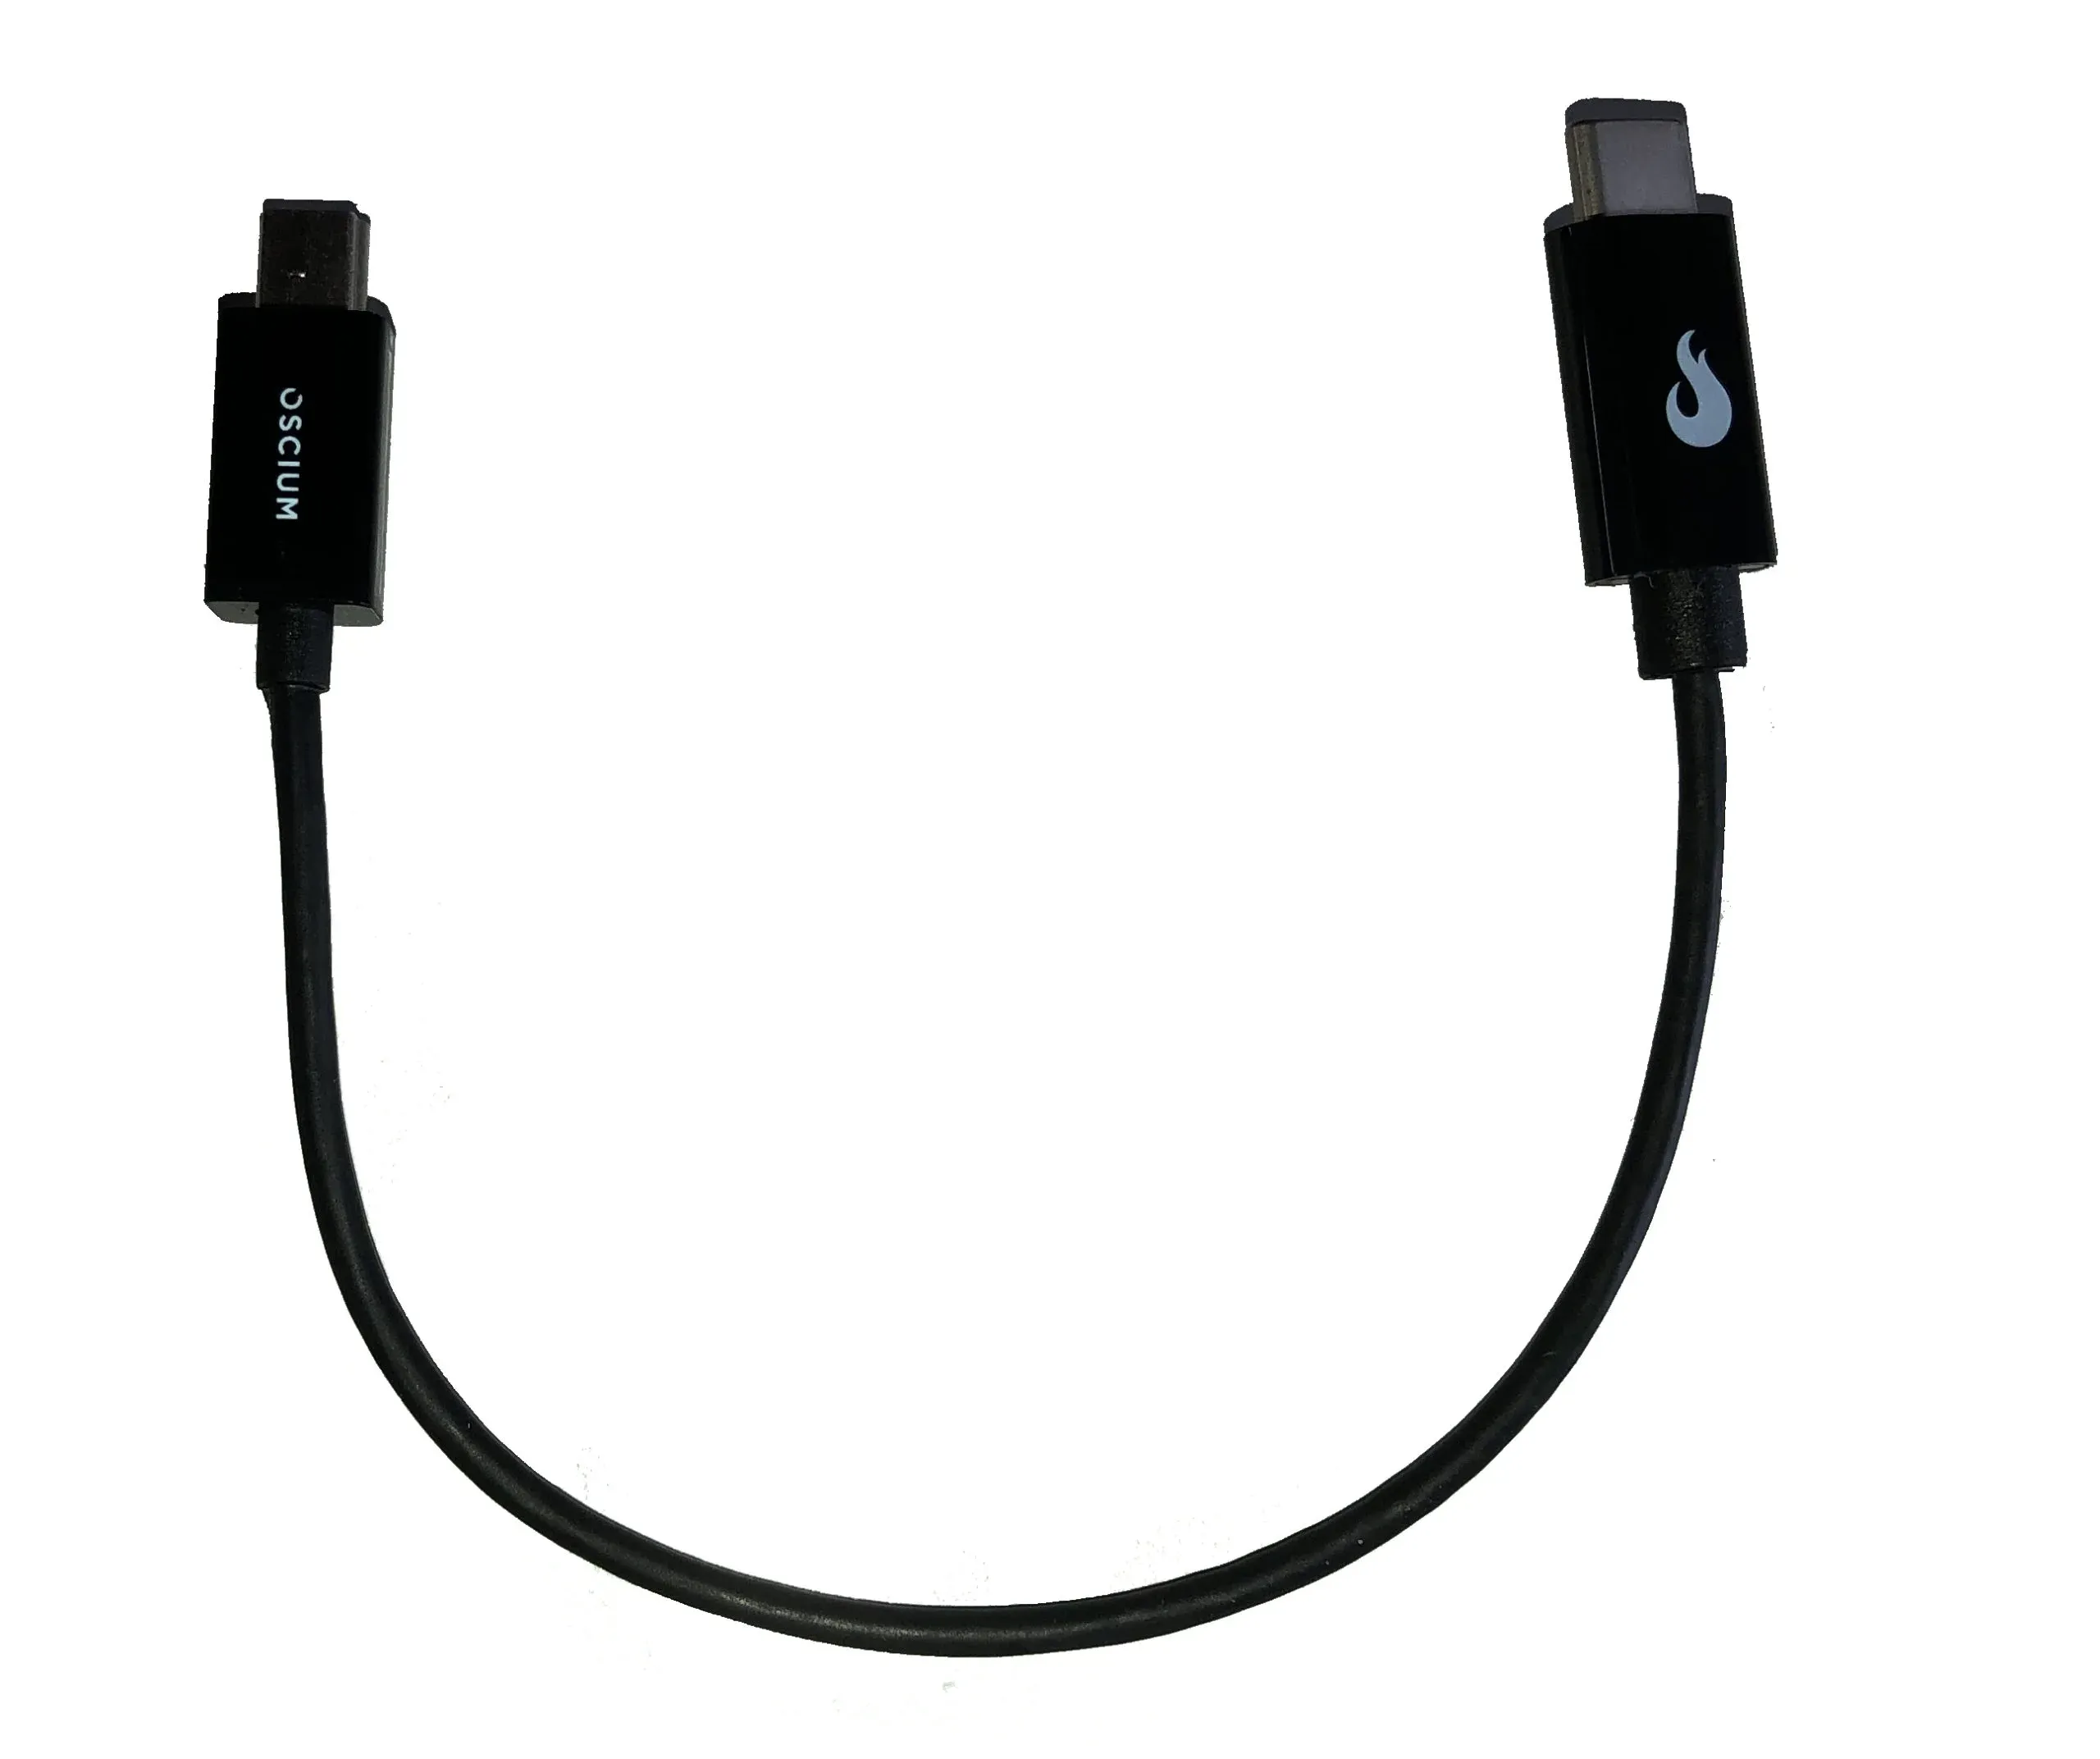
Quality Mini-B to USB-C Cable
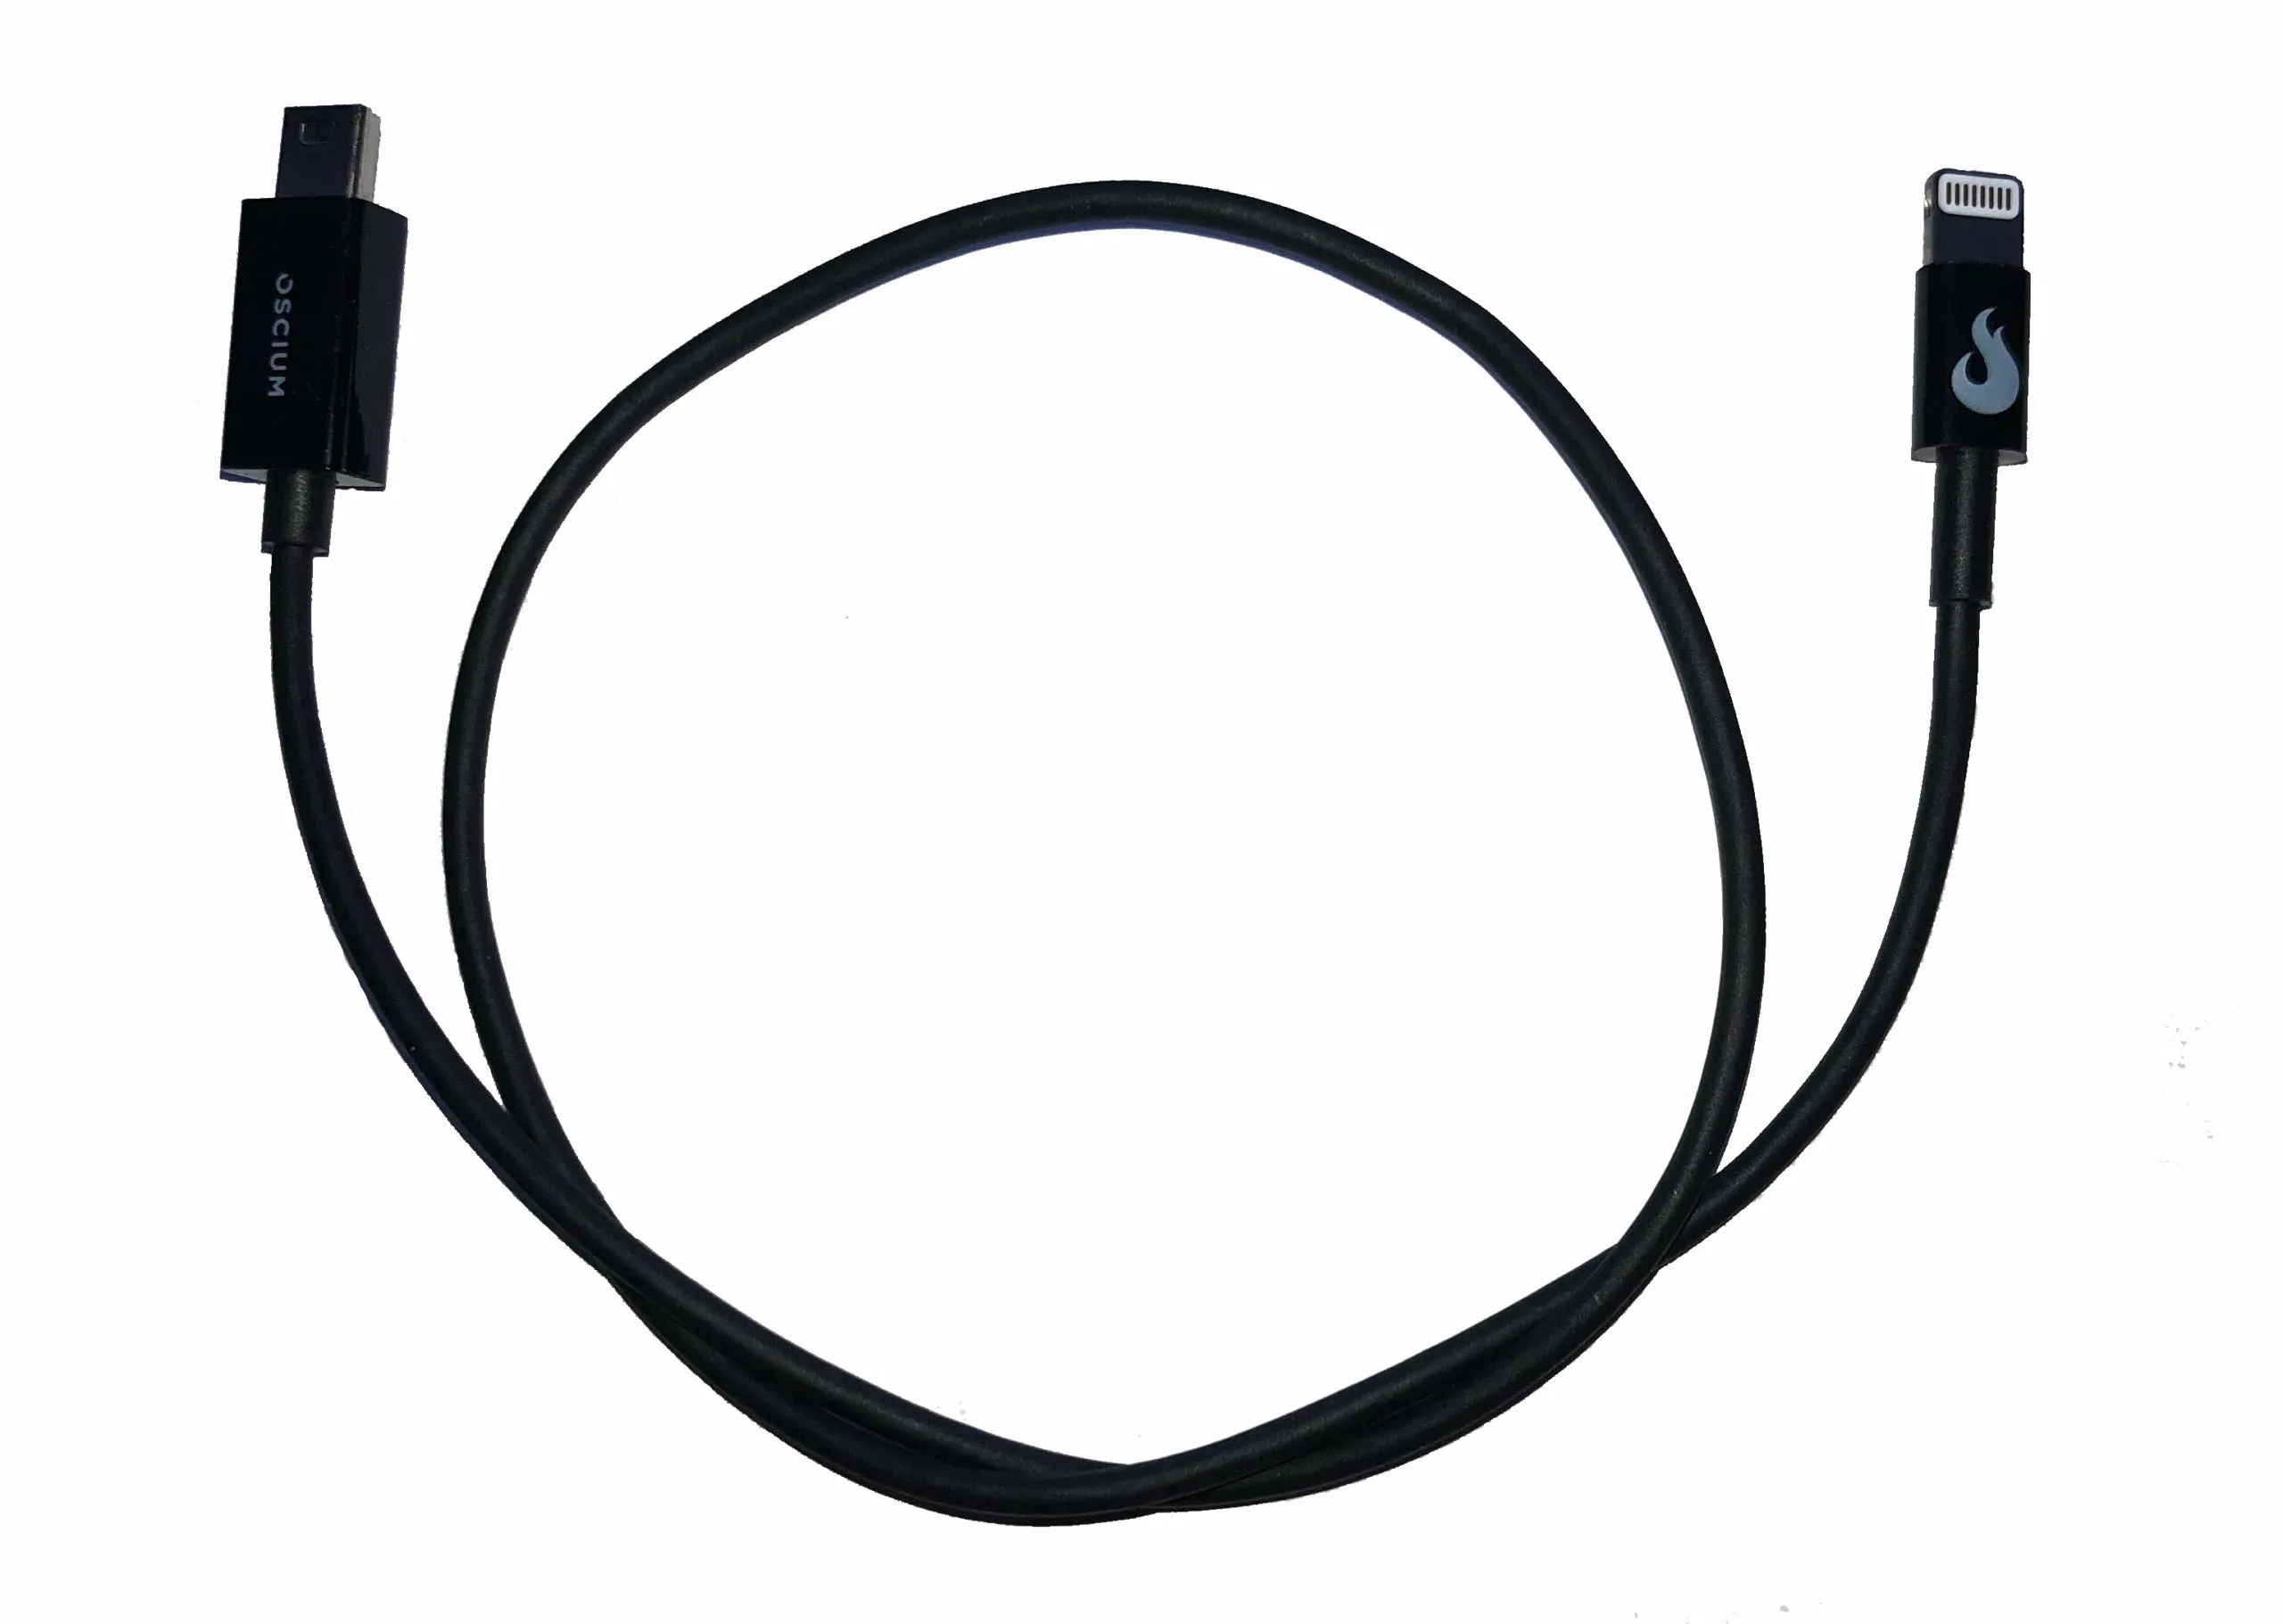
Mini-B to Lightning cable (8-inch) for connecting Oscium devices to iOS devices.
Take a 15-second quiz to find the right tool for your environment, or talk to an Oscium expert for personalised advice.
Enter your email to subscribe to our newsletter and receive updates.
At Oscium, we've spent over 16 years turning complex technology into tools that
work better for everyone.
©2026 OSCIUM. All Rights Reserved.